
 Standard Edition
The powerful statistical analysis and regression you’d expect from an expensive statistics package. Except without the complexity or the cost.
Standard Edition
The powerful statistical analysis and regression you’d expect from an expensive statistics package. Except without the complexity or the cost.
The leading software package for in-depth statistical analysis in Microsoft Excel for over 30-years.
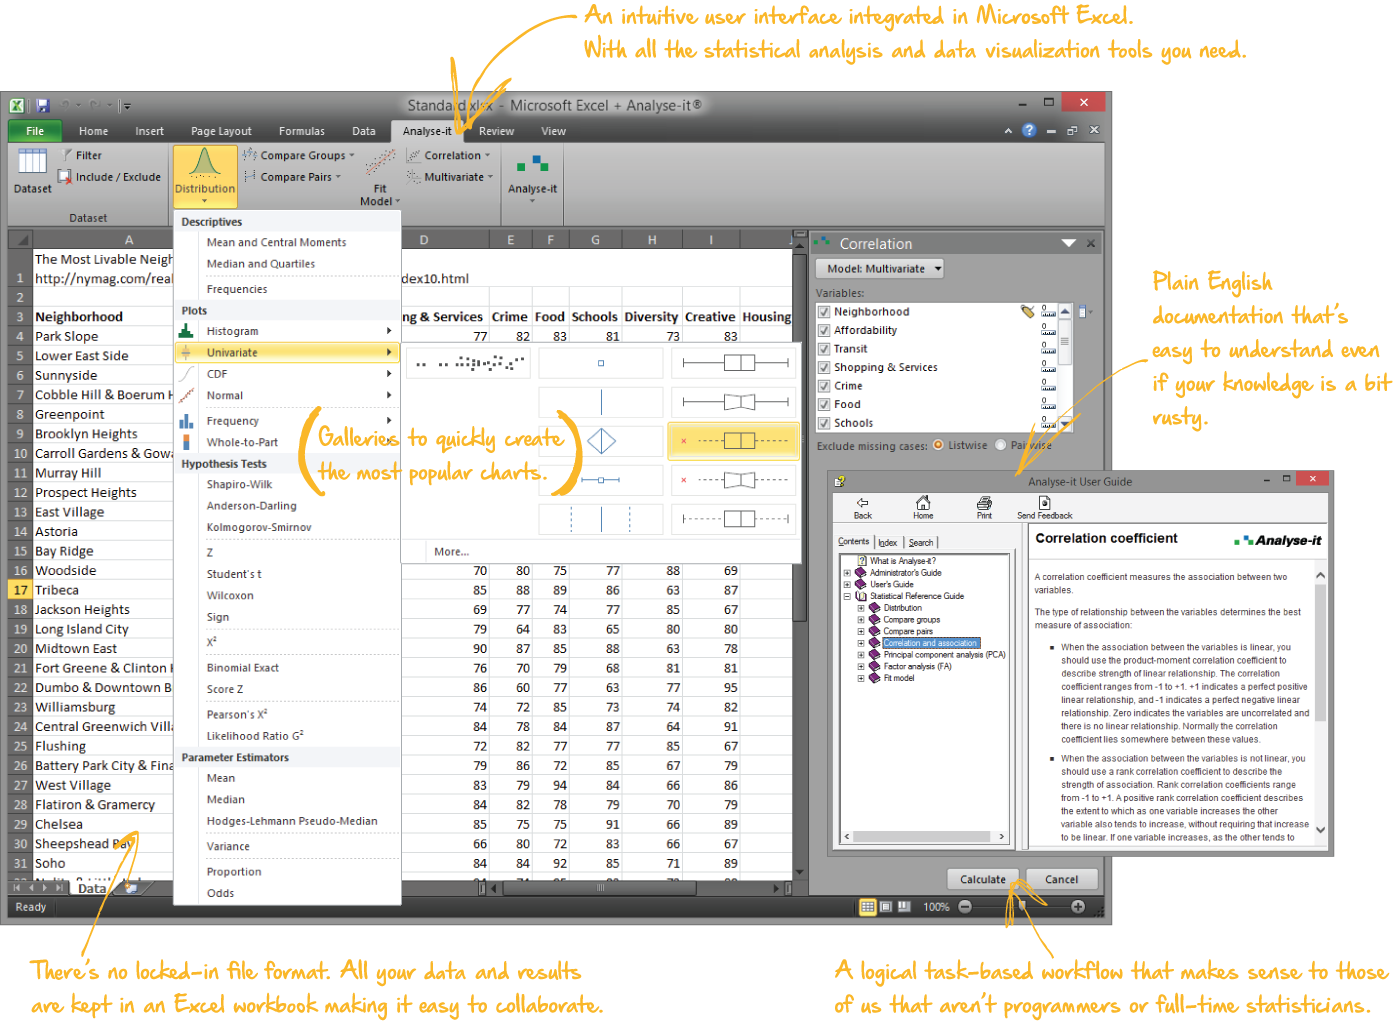
Analyse-it is the unrivaled statistical add-in for Excel. Describe and visualize data, uncover the relationships hidden in your data, and get answers to the important questions so you can make informed, intelligent decisions.
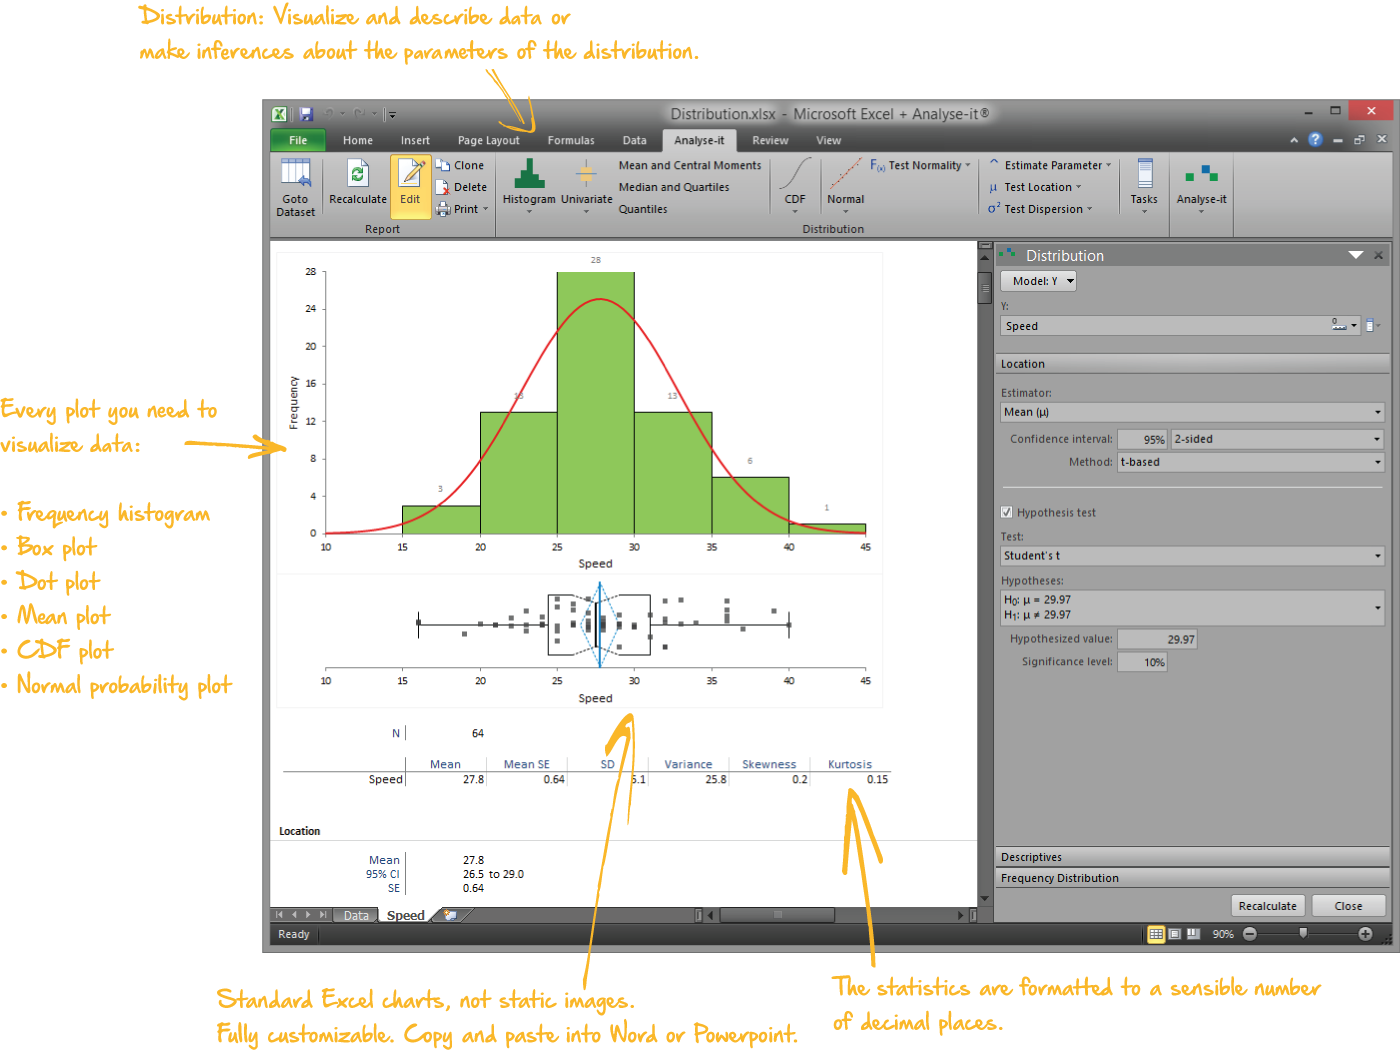
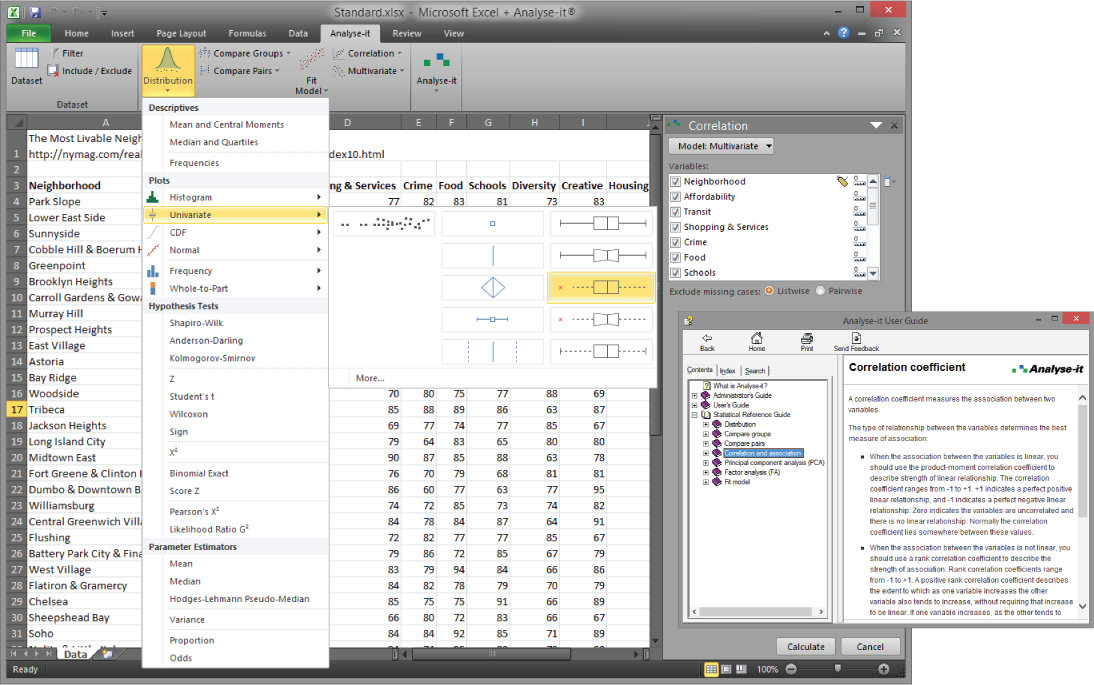
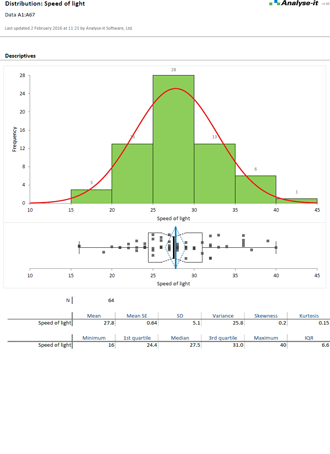
Describe and visualize data to gain greater insight
You won't get far if you don't understand the data you're looking at. Powerful descriptive statistics and customizable plots quickly reduce a large amount of data into easy to understand summaries, and to identify outlying and interesting observations.
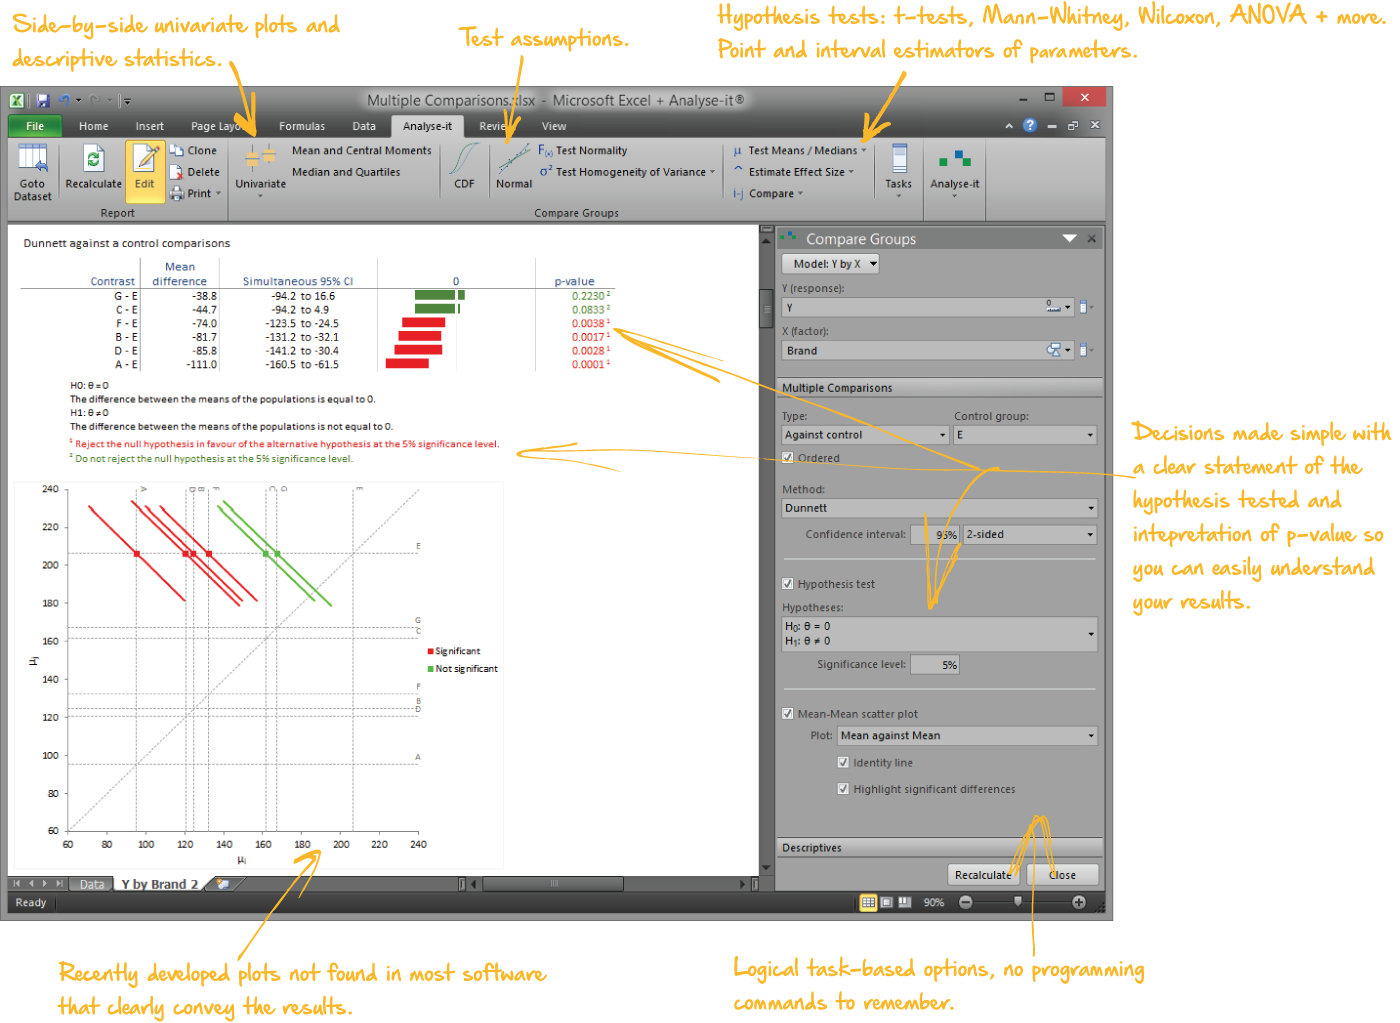
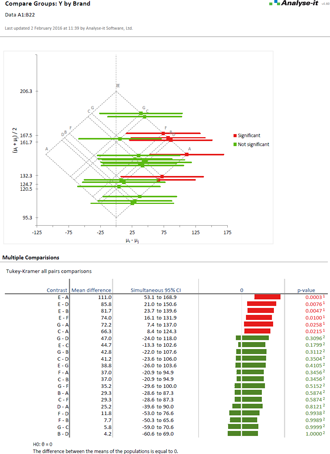
Make informed decisions
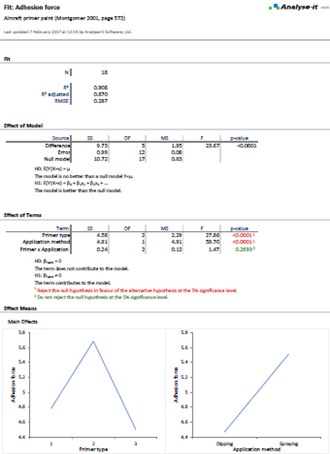
It’s important to know when the effect of a factor or intervention is real and significant. The wide range of statistical hypothesis tests and estimators ensure you make confident informed decisions. Don’t waste your time and money implementing ineffective interventions or costly changes that won’t be effective.
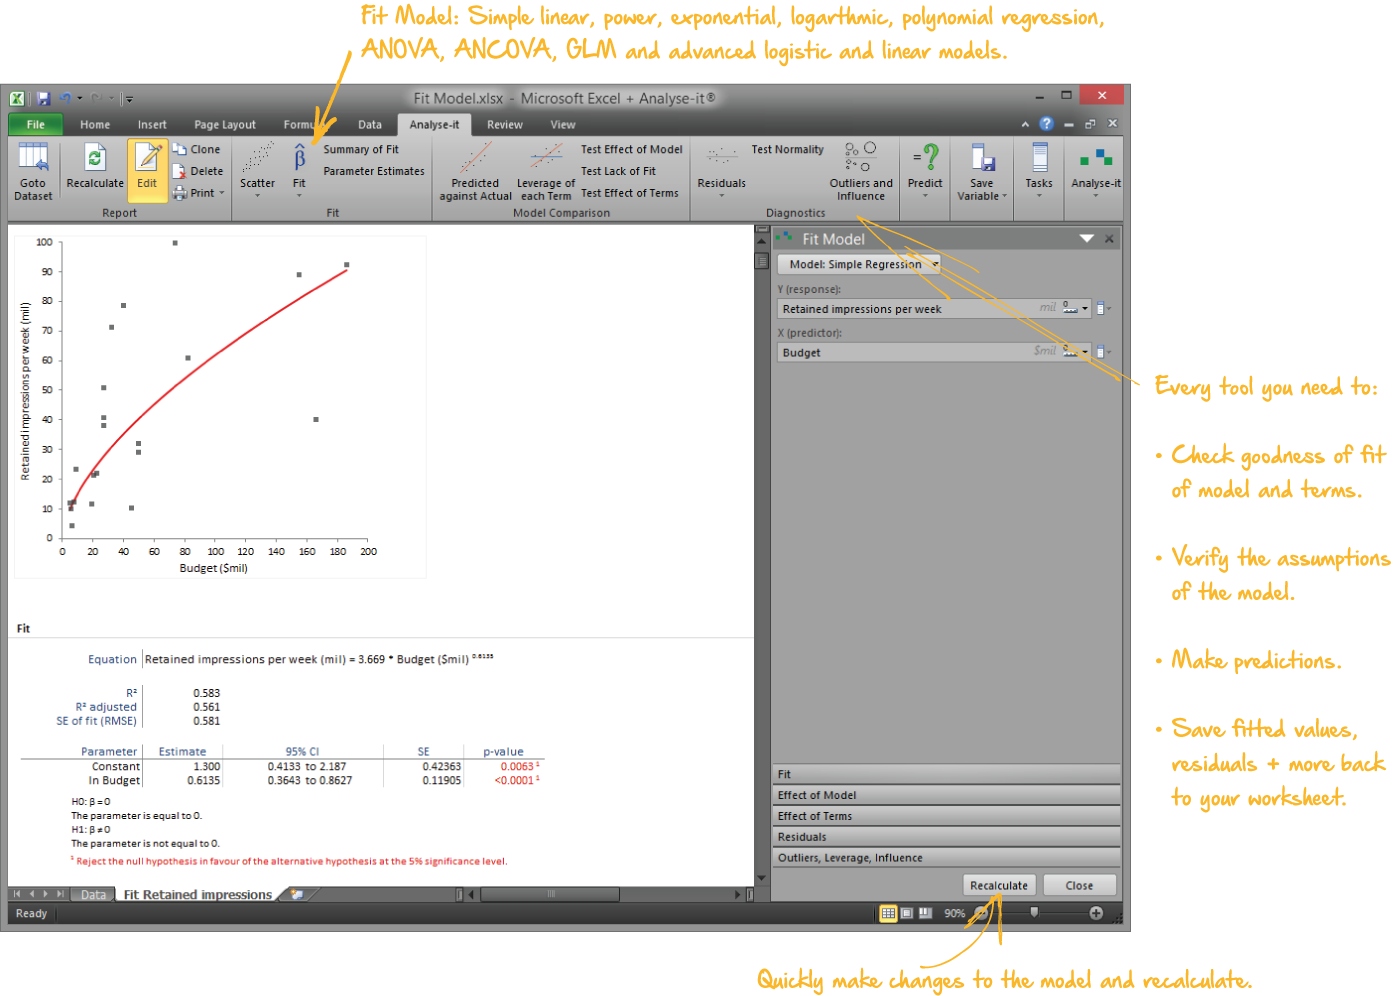
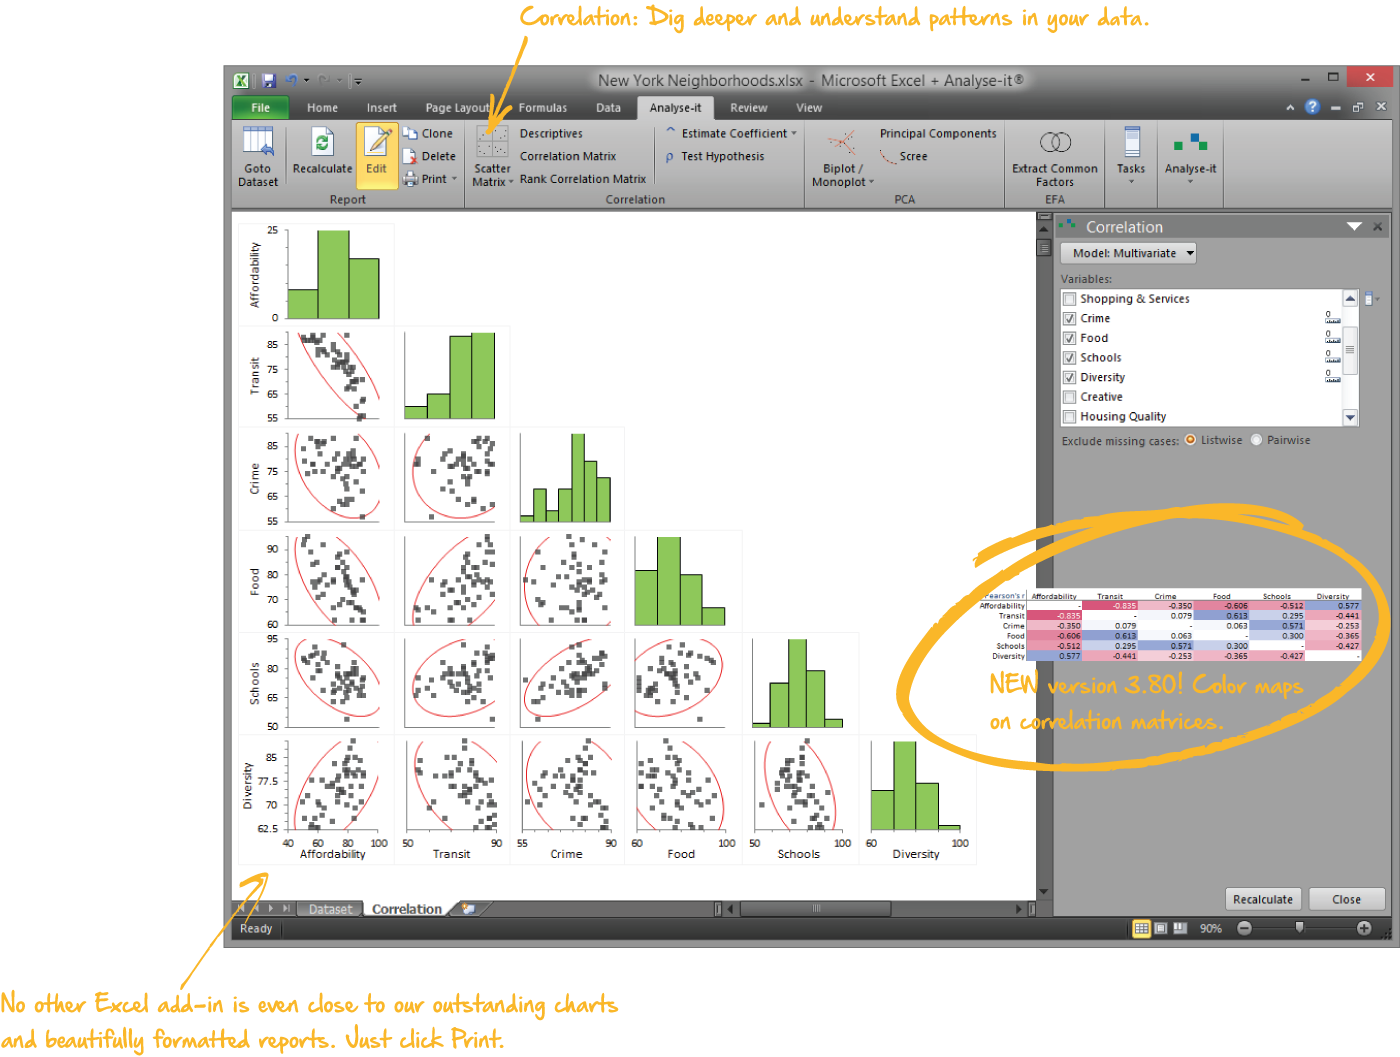
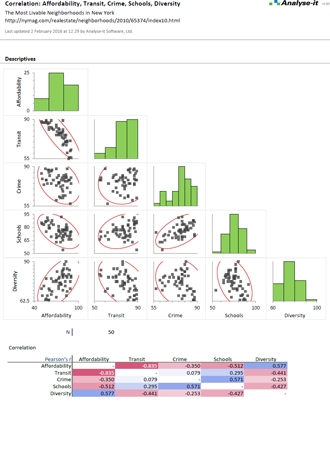
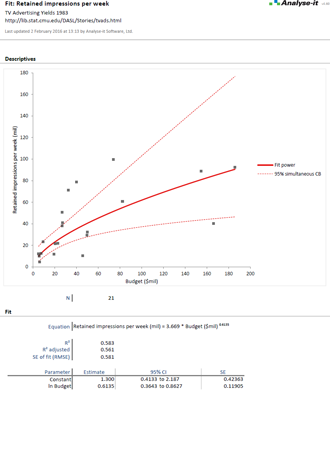
Advanced capabilities to uncover relationships
Identify relationships between variables in your data so you can understand what's important. Correlation and scatter plots help you spot hidden relationships between variables. Simple regression based on functions such as linear, log, power, or polynomials, and advanced models like multiple regression, ANOVA, ANCOVA and GLM let you model the relationship between variables so you can understand underlying mechanisms and make predictions. Analyse-it's interactive approach makes it easy to iteratively perfect the model until you're happy with it.
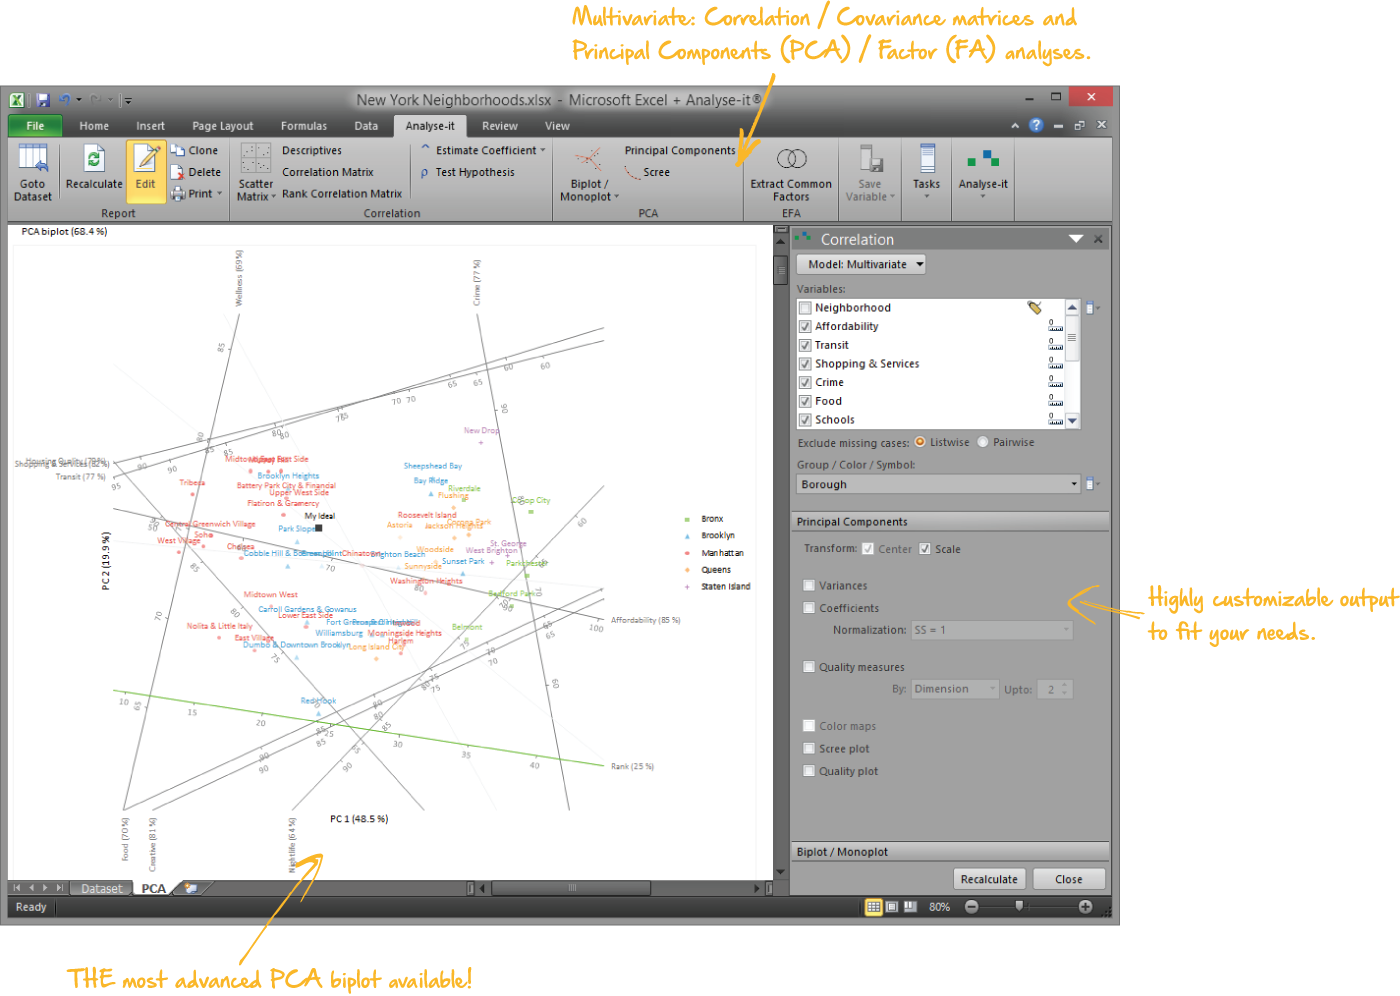
Reduce complexity to identify what's important
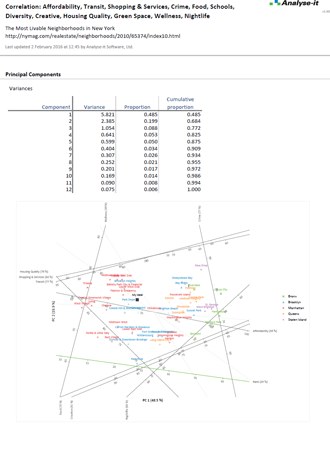
With complex datasets you often can't see the wood for the trees. What's important can be swamped by the sheer amount of data or the number of variables you're dealing with. With PCA you can quickly identify how the variables are related, and distinct groups of observations, then visualize them with monoplots and biplots (an idle boast: it's probably the most advanced implementation of biplots available in any commercial package!). Latent underlying variables can be easily uncovered with factor analysis.
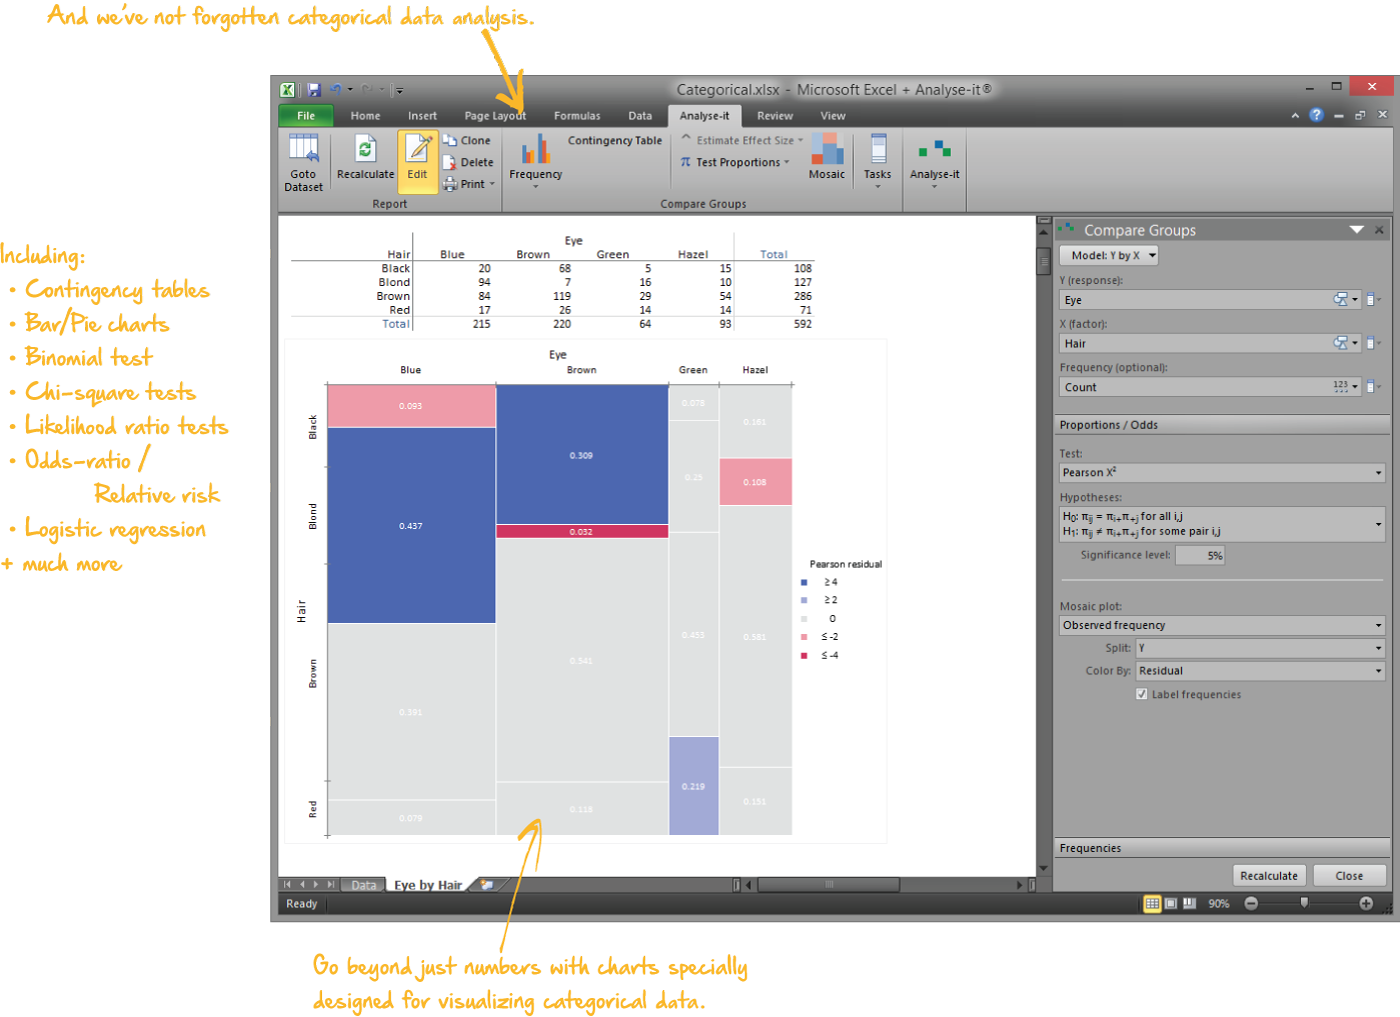
We haven't forgotten about categorical data...
Many statistical packages excel with continuous numeric data, but neglect categorical data. Analyse-it doesn't! Categorical data analysis is supported throughout with an extensive range of statistical procedures. You can describe data, test hypotheses, or estimate an effect. We've also included some insightful plots you won't find elsewhere, like Mosaic plots, so you can really see how the variables interact.
Integrated into Microsoft Excel, so it's easy to use...
That's right. Analyse-it integrates into Microsoft Excel 2007, 2010, 2013, 2016, 2019, 2021, 2024 and Microsoft 365 for Microsoft Windows. There's virtually no learning curve, and the intuitive user interface and logical task-based workflow makes sense to those of us that aren’t programmers or full-time statisticians.
All your data and results are kept in Excel workbooks, making it easy to collaborate and share them with colleagues, and meaning there's no locked-in file format.
Software you can trust
We've developed statistical software for more than 30 years, have a reputation for high-quality software, and have worked worked with some large companies on the back of that solid reputation.
But it's our customers that matter - the researchers, manufacturers, and laboratories, including many of the world's top companies and universities. Check out the latest reviews on Capterra, in the meantime here are a few of our customers...
![]()
![]()
![]()
![]()
![]()
![]()
![]()
![]()
![]()
![]()
Accurate and reliable
You might have heard Microsoft Excel isn't up to the job of statistical analysis. It isn't. The built-in functions just aren't built for accuracy. So we don't use a single one. Instead, Analyse-it handles all of the calculations internally, using reliable algorithms and IEEE 754 double floating point precision. And the results to prove it? See Analyse-it's performance against the NIST-StRD.
Validated, tested at every stage
We've conducted thousands of tests to put Analyse-it through its paces. They cover all releases and service packs of Microsoft Excel 2007, 2010, 2013, 2016, 2019, 2021, 2024 and Microsoft 365 for Microsoft Windows. What's more, validation tests are run automatically after every change to the software so you can be confident the statistics are correct. And stay correct. See our development & validation process.
Dependable support
No need to resort to old textbooks. Analyse-it includes detailed help that’s written in plain English. And if you get stuck we’re here for extra help - aiming to answer your queries within 24 hours.
Technical specification
System requirements |
|
